Last week, we talked about how users can boost productivity by using some macOS tips. Unfortunately, Mac users often overlook their Mac task manager – Activity Monitor, one of the most important apps on macOS. For those coming from Windows, Activity Monitor plays the same role as Task Manager. Users can keep their machines running smoothly by using this powerful system tool.
Mac Task Manager: A Command Center For Users
Activity Monitor allows you to see a plethora of information about your Mac. For users not familiar with the program, the amount of info presented can be intimidating. However, we here at Cydia Geeks aren’t fans of confusion. Below is our breakdown of your Mac task manager, to help you better understand your Mac task manager:
The CPU Pane
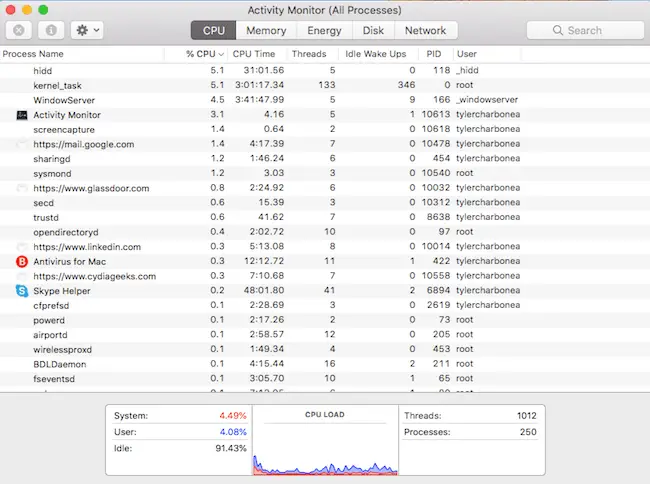
Activity Monitor immediately greets users with the CPU pane. This screen gives users a picture of how hard their computers are working. As seen above, processes and running apps are shown in a list. That list displays the most demanding processes in descending order.
Categories and More Categories
As you can see, there is a lot of information to digest at first glance. Here is a quick summary of each column within the CPU pane:
- Process Name: Just as it sounds, these are the names of the processes and apps currently running on your Mac. These tend to shift positions automatically as time goes on.
- % CPU: How much processing power each task is taking up, out of 100%. Accordingly, these percentages can change with every second or minute, bouncing processes up and down on the list.
- CPU Time: The total amount of time a given app or process has been actively running.
- Threads: Processors have a total number of available threads that can be devoted to tasks. Like highways have lanes to distribute traffic, your Mac assigns tasks to threads. Demanding processes that require more resources typically use more threads than others.
- Idle Wake Ups: Shows how often an app or process has “woken up” the processor from an inactive state, during a given time period.
- PID: Each process or app’s unique identification number.
- User: Each process or app has its own privileges on macOS. Depending on what level the process or app runs at, it is labeled accordingly. Some processes must run at the core of macOS, or run at root. Others run only on the user account that is currently signed in, denoted by the username. Finally, some processes need access to external resources to do their jobs.
Additional CPU Info
The average user will spend most of their time in the CPU section of Activity Monitor. This will allow users to view what they have running, and see each item’s impact on performance. If an app is causing trouble and taking up too much processing power, users can either quit or force quit that process by clicking the stop sign in the upper lefthand corner.
Activity Monitor also provides some useful graphs and info at a glance near the bottom of the window. From left to right, you can see how much processing power both macOS and user processes are taking up. The idle percentage shows how much free processing power is still available to use.
The middle graph visually displays processor usage over time. Here you can view any spikes or trends in CPU usage, to monitor and diagnose performance. Finally, the righthand box shows available threads alongside busy threads.
Because CPU activity changes constantly, all information shown changes in real time.
The Memory Pane
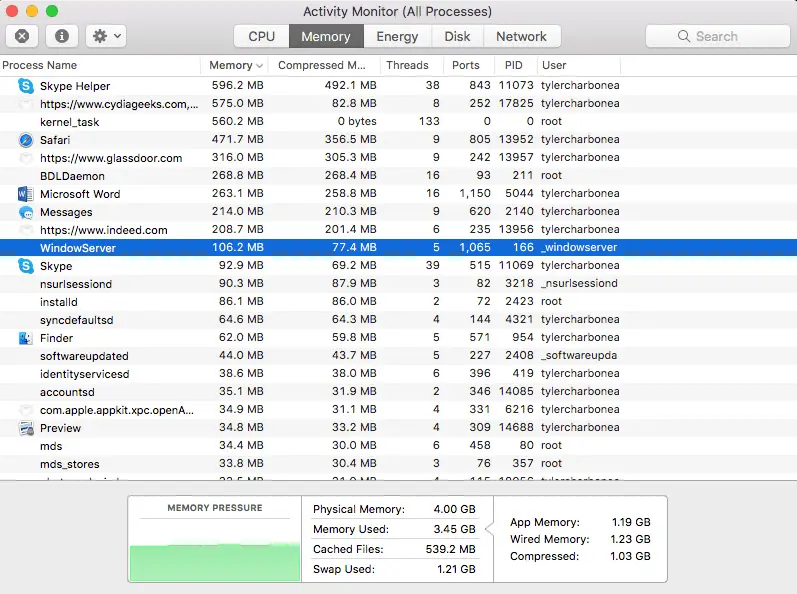
Activity Monitor also shows how much memory each process is taking up on your Mac. Though memory usage is also reported in real time, it tends to fluctuate less than CPU usage. Memory usage in macOS tends to be more stable, although the numbers do change.
Similar to the CPU pane, the memory pane shares some common categories such as Process Name, Threads, PID, and User. However, there are some unique categories that shed more light on memory usage in your Mac task manager:
- Memory: The most crucial column in the Memory pane, which shows how much memory an app or process is using at a given moment in time. This memory is often referred to as RAM.
- Compressed Memory: While each task uses a certain amount of memory, macOS takes steps to increase system performance. The amount of memory processes use is compressed, meaning they will use less virtual memory to run. This allows for faster performance both in and out of apps. Just like photos are compressed to take up less storage, memory is compressed to reduce impact.
- Ports: Similar to threads, ports allow apps and processes to access RAM. The more ports a process uses, the heavier that process is.
Additional Memory Info
Memory is unique in that the total number of running process exerts pressure, or load, on your Mac’s RAM. When certain apps or processes require heavy memory usage, it is common for pressure to increase. As seen in the graph above, green memory pressure indicates that the system is stable. When your Mac’s RAM is overextended, this graph will often turn red.
The middle graphic shows the total memory available to your machine, along with the memory currently used. Cached files are those held in a preserved state in memory, allowing for faster access at a later time. Swap is another name for virtual memory. When macOS needs memory for a task, it will throw unused items into the swap, allowing for a needy program to access physical memory directly. This virtual memory is a temporary collection of idle tasks, which the system can reactivate at any time.
————–
These next few panes in Activity Monitor are likely less consequential for most users, and will be expanded upon just briefly…
The Energy Pane
Here, users can view the battery usage impacts of their apps, and the processes associated with them. Each process effects your Mac’s battery life differently, and Activity Monitor assigns each a score. The higher the number, the more energy that item uses. Similar to how vehicles calculate an average fuel economy, Activity Monitor will show you the average energy impact of each task. Naturally, some will be bigger battery hogs than others.
MacOS will show if open apps are in App Nap, or sleep mode. If an open app is inactive or minimized for a long period, macOS will suspend this app in a frozen state to reduce battery usage. Activity Monitor shows if your Mac is limiting background activity for those apps.
The Energy pane will also show you if an app requires high CPU usage, thus using up more battery power. Lastly, the pane will notify you if any apps or processes are preventing your Mac from entering sleep mode.
A collection of graphs will show trends in energy usage over time, and the remaining charge for your battery.
The Disk Pane
The Disk pane revolves around hard drive activity and performance. Whether your Mac has an HDD or a solid-state drive, Disk will display how much data is being read or written by active tasks and apps. As apps and processes read and write more, your Mac task manager will update the totals within the list. Each of these processes will be classified as either 64 or 32 bit, though modern macOS disk processes will almost universally be 64 bit.
Charts at the bottom of the pane provide reads and writes per second, including total reads and writes. MacOS summarizes the amount of data read and written, and gives users a clear picture of how their drives are running.
The Network Pane
In a nutshell, the Network portion of Activity Monitor shows how much data is being sent and received by your Mac. Apps and processes that rely on an internet connection transmit data back and forth to the cloud, allowing users to access certain functions.
Processes that do not rely on a connection will send and receive 0 bytes of data. However, apps like Skype need to communicate with their servers to work properly. This communication is apparent by the number of bytes sent and received. This data is often sent as units called packets. Your Mac task manager shows both total packets sent and total packets received. Downloads and uploads fall under these categories.
Closing Notes
Thanks to our guide, hopefully you will have an easier time understanding the inner workings of your Mac. Though Activity Monitor can appear complicated, the information is actually fairly easy to decipher. All it takes is a little know-how. Armed with the above knowledge, you will be using your Mac task manager more efficiently than ever before.